
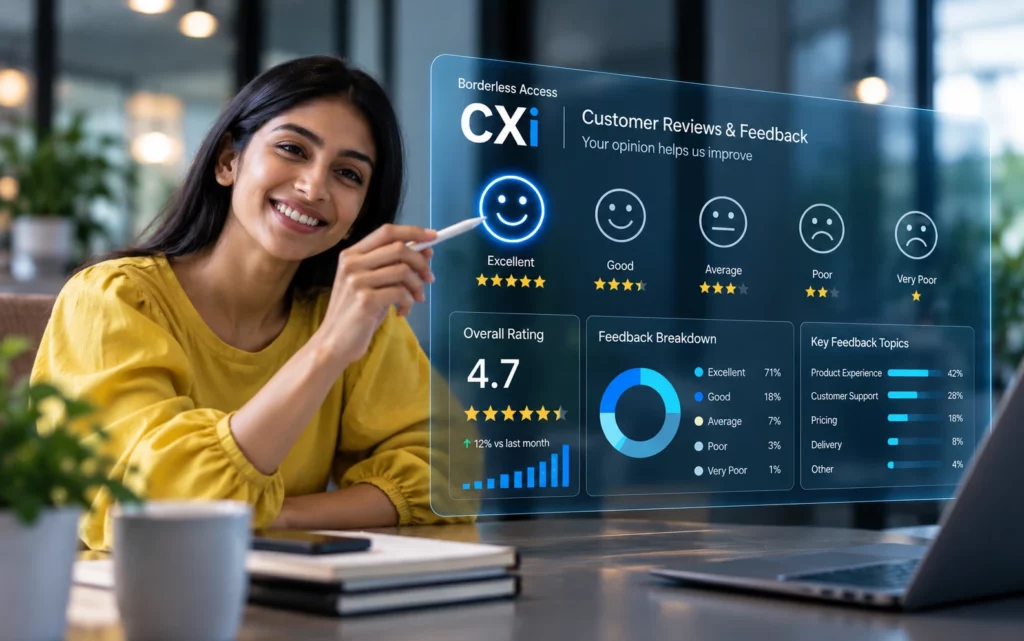
Customer experience research is the discipline within broader consumer research that tracks how customers perceive a brand and its products across every interaction, and why they act the way they do. Because it spans so many touchpoints, it is tempting to report it as a set of isolated scores, and that is where it starts to mislead.
Misreading usually starts when a company treats the study as a one-off. A survey goes out, a dashboard gets built on it, and nobody tracks how perception shifts over time. A quarterly NPS reading then gets treated as the verdict on customer sentiment, when it is one data point in a longer trend. Without context on journey stage, segment or a recent trigger such as a delayed shipment or a price change, the same score can make the experience look better or worse than it is. A slowing trend can also hide under a flat or rising score, and the loyalty it costs shows up in customer retention data months later.
That is why continuity matters. CX research has to be tracked over time and mapped across each stage of the customer journey. Done well, it spots attitude shifts early enough to protect revenue that would otherwise leak away.
A high CSAT or NPS score records how a customer felt about one interaction. It says very little about what they will do next. Customers can report satisfaction and still cut spending or switch, and most companies never see it because sentiment and behavior sit in separate systems.
This is the customer experience research paradox, where the scores are high, yet the predicted business outcomes follow a different trajectory. Leadership reads a rising CSAT and NPS trend as proof the experience is improving, while repeat purchase and retention data tell a different story.
This is also where CX research parts ways with customer satisfaction research. Satisfaction research asks how a moment went, while CX research asks what the whole relationship is doing to future behavior.
Four gaps usually explain the disconnect.
A “good” score convinces leaders the program is working, so nobody investigates, and the early churn signals that behavioral data could have flagged in time get dismissed.
Each CX metric covers one part of the relationship, and none of them tells the whole story alone. CSAT (Customer Satisfaction Score) flags friction at a specific touchpoint. NPS (Net Promoter Score) gauges relationship-level loyalty through stated likelihood to recommend. CES (Customer Effort Score) measures how hard an interaction was, which makes it an early churn signal. Retention and repeat intent show whether a good experience turns into repeat behavior. Competitive benchmarking shows whether a score shift is yours alone or category-wide, which requires hearing from customers you don’t own, something Borderless Access reaches through a global panel of 100M+ verified panelists across 90+ markets.
The practical question for a CX leader is which metric answers which decision. Relationship NPS, run quarterly, tells the board whether loyalty is holding at the brand level. Transactional CSAT and CES, triggered right after a support call, a delivery or an onboarding step, show operations where a specific process is failing. Retention and repeat-purchase data act as the check on both, because they record what customers actually did. Reporting all of them on one dashboard, cut by segment and journey stage, gives leadership a single view of the experience and settles the argument between competing departmental scorecards.
Attitudes move between touchpoints. A delayed delivery can change what a customer does next, even if they reported satisfaction the week before.
Customer experience survey is cumulative, and attitudes change after multiple uses or service lapses. Customer journey mapping helps here. Scored stage by stage, it shows exactly where satisfaction drops and what caused it. Tracked continuously, it flags friction before it shows up in churn.

CX research often gets analyzed and then shelved before it reaches the teams that could act on it. When only the research team reads the report, product, support and operations never see the data that should shape their decisions.
Product teams can trace recurring customer pain points and set priorities on evidence of reported friction. Support teams can read sentiment trends before tickets arrive and see what is driving a rise in complaints. Operations teams can use touchpoint feedback to fix process lapses at the source before complaints pile up.
Unsolicited feedback deserves the same attention. Customer reviews, app-store ratings, social comments and support transcripts carry the words customers use when nobody is asking them a survey question, and those words often name a problem more precisely than any rating scale. Text analytics can group thousands of comments into themes and track how each one grows or fades. When a theme such as slow refunds climbs in reviews while CSAT stays flat, the team has an early warning the survey missed. The final step is closing the loop. Customers who flagged a problem should hear what changed, and frontline teams should see which fixes moved the numbers, since that visibility is what keeps them using the research.
When each team works from the data directly, fixes happen early enough to correct course. That means formatting findings for each audience, such as a friction-point analysis for support and a feature-gap summary for product. Mapping customer experience insights to specific touchpoints lets each team locate where an issue starts. Real-time dashboards keep that view current, where a static report goes stale within weeks.
Understand how consumer preferences and purchasing behavior can inform customer insights and better business decisions. Explore consumer behavior trends in Saudi Arabia.
Your CX research may report what is happening, whether a dip in satisfaction or a falling NPS, without diagnosing why or what to do about it. That gap between measurement and diagnosis is where most programs stall.
The most effective customer experience research methods are the ones matched to the problem in front of you. A satisfaction drop after one interaction calls for root-cause analysis at that touchpoint, with the change isolated before anyone generalizes from it. A slow loyalty decline calls for driver analysis, such as Shapley regression. It apportions how much of the shift each factor explains, so effort goes where it counts. Mapping recurring support contacts to the workflow step behind them is how CX research pinpoints customer pain points precisely enough to fix. Where the numbers show a pattern without a reason, qualitative interviews supply the why.
In practice, most programs lean on surveys and underuse the rest of the toolkit. Relationship and transactional surveys are good at sizing a problem across the customer base. Explaining it usually takes in-depth interviews or diary studies, which capture how an experience unfolds over days or weeks. Journey mapping workshops draw on both to show where handoffs between teams break down, while usability testing catches friction in a digital flow before it ever reaches the dashboard. Quantitative work tells a leader how big a problem is and where it sits. Qualitative work explains why it happens and what a fix should look like, and a mature program moves between the two deliberately, using each to test what the other suggests.
A general survey applied to every case describes a problem without locating its cause. Matching method to problem is what turns tracking data into corrective action.
No single metric can carry a strong CX research framework, because each responds to one behavior. NPS will show that sentiment moved without showing why. Pairing it with CSAT at each touchpoint and CES for effort covers different parts of the same experience. Behavioral data like usage patterns, retention, and frequency of repeated contact can be layered further to bridge the gap between what customers say and do. When high customer satisfaction research sits next to flat usage, that mismatch shows where to act.
Attitudes also move over time, and a customer at onboarding is a different customer three months later. Each stage of the journey has its own expectations. A reading taken at one arbitrary touchpoint can miss the pattern that actually predicts loyalty and churn. The trajectory is what signals whether trust is climbing or falling.
This is the gap a composite framework is built to close, and Borderless Access’s CXi framework shows what capable b2b customer experience research looks like in practice. It combines four pillars (Performance, Advocacy, Reconsideration and Competitive Advantage) into a single index that shows what is shaping customer behavior.
CXi then runs driver analysis to find which attributes move each pillar and plots them against performance. The resulting priority map sorts every attribute into Fix first, Keep doing, Over-invested or Low priority, so each function sees its own gaps. It also separates design problems from execution problems, telling a leader whether the fix is a policy change, a UI change or agent coaching.
Consider an illustrative scenario. A mobile operator sees retention falling while its brand growth stays popular. Its CXi study shows Advocacy at 72. Reconsideration is down at 54, though, and Performance at 58, which drags overall CXi to 62 when the industry average is 70. Driver analysis points to two culprits, confusing bills and poor first-time resolution. So the operator rewrites its bills in plain language and lets agents settle issues on the first call. Urban network upgrades move up the priority list too. The modeled outcome is a CXi lift of +7 points in six months and churn reduced by ~15%.
Fixing a customer experience research framework rarely requires starting from scratch. Made in the right order, small changes improve results without new budget.
Before any of that, pin each study to a decision. A brief that names the choice it will inform, such as whether to redesign onboarding or add support headcount, determines which customers to sample, which touchpoints to measure and what result would change the plan. Studies that begin with a list of questions and no decision attached tend to produce interesting findings that nobody owns.
Start with the touchpoint generating the most friction, even when easier ones are tempting. That might be slow response times, a failing checkout or a vague onboarding step, and it is where attitudes turn negative and where a fix pays off fastest. Once it stabilizes, work down the friction list methodically. Each change proves its value before the next, more complex one begins.
Most companies already hold usable behavioral data they have never analyzed. Product analytics show drop-off points and feature adoption, CRM records hold repeat-contact history and resolution times, and customer reviews add unprompted feedback, all of which expose friction well before a new study would. Reviewing them first tests the research team’s assumptions. It also stops budget going into studies of problems already visible in existing data. New research then explains the causes behind those patterns.
A framework change does not need to reach every team at once. Starting with one team keeps the test focused and shows whether the customer experience insights actually drive better decisions. Once proven, the approach extends to other teams with the refinements already built in. That avoids an organization-wide rollout that lacks evidence and may have to be reversed. The best pilot team is usually the one that owns the highest-friction touchpoint and can change it without a long approval chain.
Set a checkpoint, and a quarter is usually the practical choice. It is long enough to show behavioral or operational change and short enough to stop an untested reform running indefinitely. At the checkpoint, check whether the original friction point improved. Then ask whether the insights drove real action and whether the process is ready to scale. Tie the checkpoint to one business number agreed in advance, such as repeat-contact rate or renewal rate on the affected journey, so the review becomes a clear yes-or-no conversation.
Tracking brand equity and customer experience in separate programs hides how each one moves the other. What a customer felt after an interaction shapes their perception of the brand and its product. A delayed delivery or a poor support interaction lowers satisfaction and also erodes the perceived quality and trust the brand took years to build. Those are the measures brand equity tracking captures. Repeated often enough, those interactions pull down the equity score and shape every future purchase decision.
Run in isolation, brand equity tracking reports that perception is falling without explaining why. CX metrics flag friction without showing its cost to the brand. Connecting the two ties specific interactions to movements in equity measures such as quality and trust, which exposes the operational gaps eroding the brand. This link is also what makes CX spend defensible in a budget review. A fix at one touchpoint can be traced to the trust and quality scores that support pricing power, and that is an argument finance teams tend to accept. Borderless Access’ CXi framework makes that link measurable. It compares how willing customers are to recommend a brand with how good their experience actually is, and flags the cases where the two pull apart. A strong brand image can keep recommendations high even while service quietly gets worse, and that gap is exactly where brand equity starts to wear down
Brand perception is built one interaction at a time, and it erodes the same way. Tracking both together shows leaders what is actually moving the brand.
Explore how online shopping preferences and purchasing behavior can add context to customer experience and brand perception research. Discover eCommerce consumer insights
The next shift in customer experience research is the speed of interpretation. AI can now read thousands of open-ended comments, support transcripts and reviews in the time a team once spent coding a sample, and it can flag a sentiment turn within a week of data. That shortens the distance between a customer’s frustration and the team able to fix it. AI can also probe a vague open-ended answer with a follow-up in the moment, and predictive models can combine survey and behavioral data to flag which customers are drifting toward churn. Those models are only as reliable as the responses beneath them, which makes respondent quality part of the CX question. What AI cannot supply alone is judgment about which signal matters in this category, in this market, at this stage of the relationship. The programs that pull ahead will pair machine-scale pattern detection with researchers who can tell a noisy dip from the first sign of a segment walking away, the balance of AI speed and human context that Borderless Access builds its research operations around. For leaders, one question is worth asking every quarter. Do our CX research findings change a decision before the retention data forces one?
Identify the gaps behind customer churn and turn customer experience insights into actions that strengthen loyalty and retention. Talk to our research team.
How do you detect the gap between reported data and real-world scenarios?
Compare survey data with behavioral data like usage logs and support tickets. A mismatch, such as high satisfaction alongside high churn, points to response bias or timing issues. Pairing the two shows which source reflects what customers actually do.
How reliable is frequency measurement in CX research?
It is only as reliable as people’s memory, which is patchy. Answers drift between survey waves, and rare behaviors are the easiest to misremember. When usage frequency matters, pull it from behavioral data instead. Self-report works better for attitude and intent.
What are the good NPS/CSAT benchmarks?
NPS and CSAT benchmarks vary widely by industry, region and survey method, so a published average is a rough guide at best. The most useful benchmark is your own trend line alongside direct competitors measured the same way. Context of historical trends and competitor activity is important since methodology may interfere with cross-company comparison.
CES vs. CSAT: which one should you track?
CES (Customer Effort Score) asks how much work it took to get something done, and in service settings that tends to predict loyalty well. CSAT asks whether the customer was happy with an interaction or with the product as a whole. If support is your priority, CES usually tells you more.
How much qualitative versus quantitative CX research do you need?
Strong CX research uses quantitative data for scale and trends and qualitative data for context and cause. Large samples build confidence in a pattern but rarely explain it. Qualitative depth explains the cause but cannot show how widespread it is.
What are the benefits of customer experience research?
It shows leaders which parts of the experience drive retention and revenue, so investment goes to the touchpoints that matter most. It also gives early warning of churn, grounds product and service priorities in evidence, and shows how the experience compares with competitors. Run continuously, it becomes a management tool that informs decisions well beyond the research team.
© 2026 Borderless Access Pvt Ltd. All Rights Reserved.